
Reports and Analytics Enhancements
release date 30 May 2013
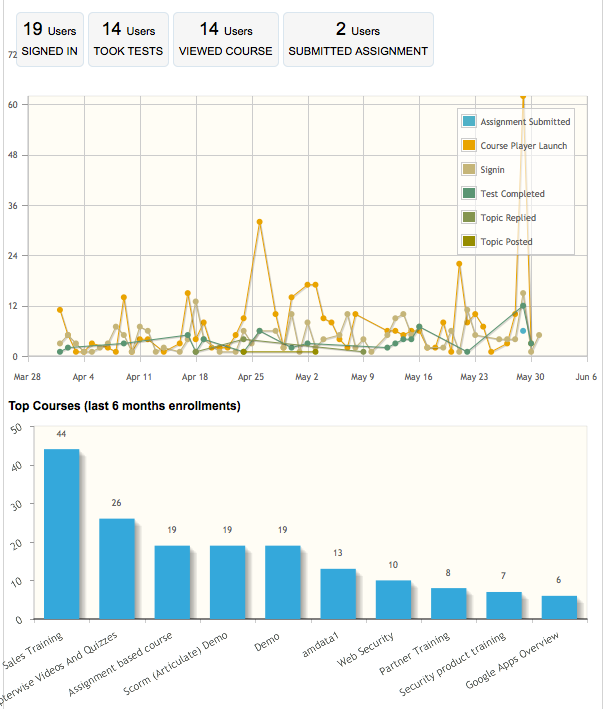
Dashboard
Site owner and admins would be able to get a snapshot of important statistics about their microsite on the dashbaord. You can see how many users logged in in last 60 days, how many viewed courses, how many took any tests etc.
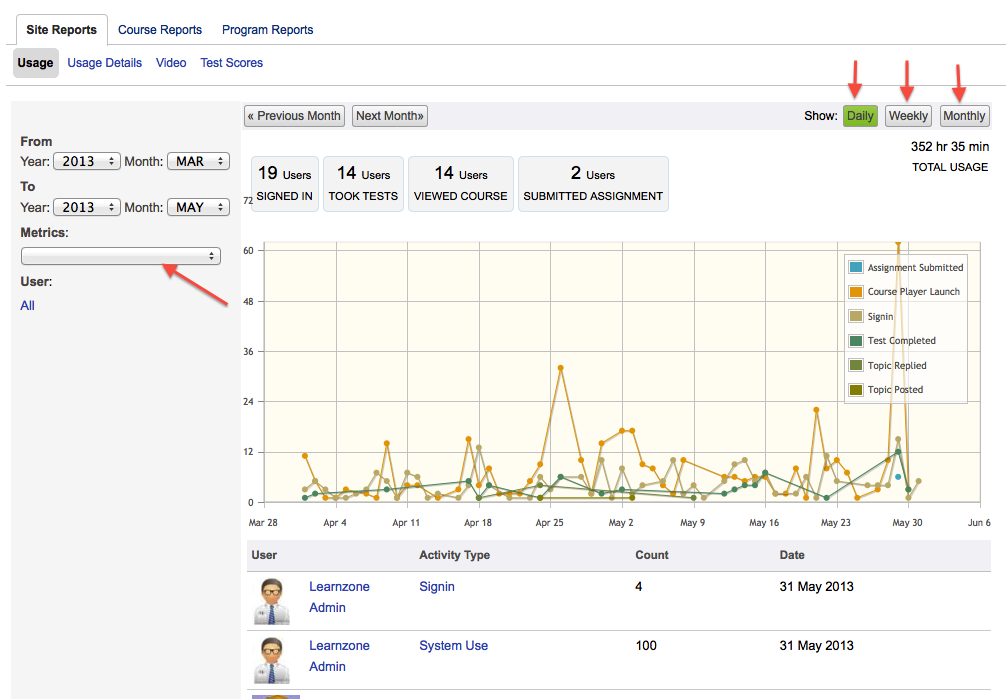
Site Usage
View the daily, weekly or monthly usage chart for the site, for any specific date range you select. Below the chart you can see the active users who actually performed these activities.
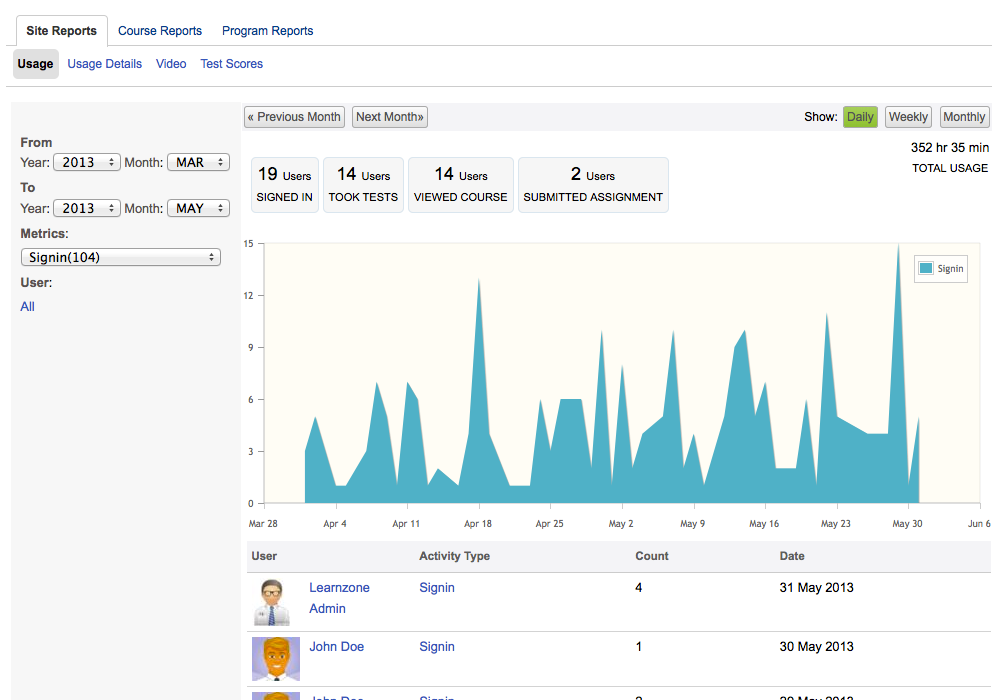
Site Usage - Specific Activity
You can filter the site usage for specific activity. User list below the chart will show users who performed that activity in the selected period.
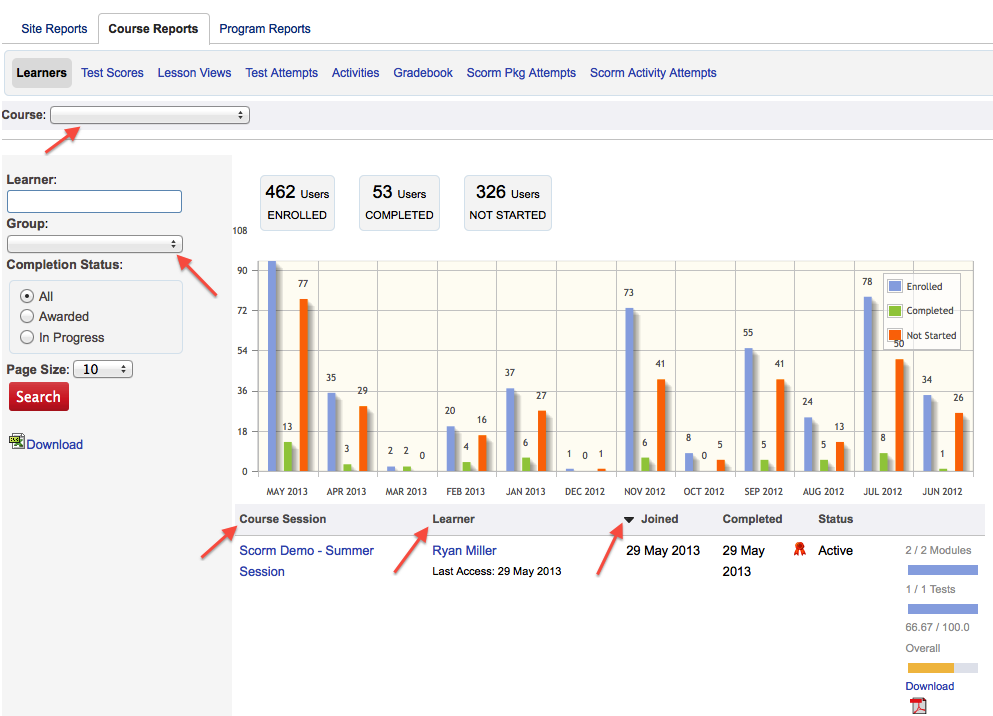
Learners Enrollments
This report shows monthly distribution of enrollments, completions and not started counts. You can filter the data by period, group, course, course session etc. The list below chart provides further sorting and filtering options based on completion status, specific learner.
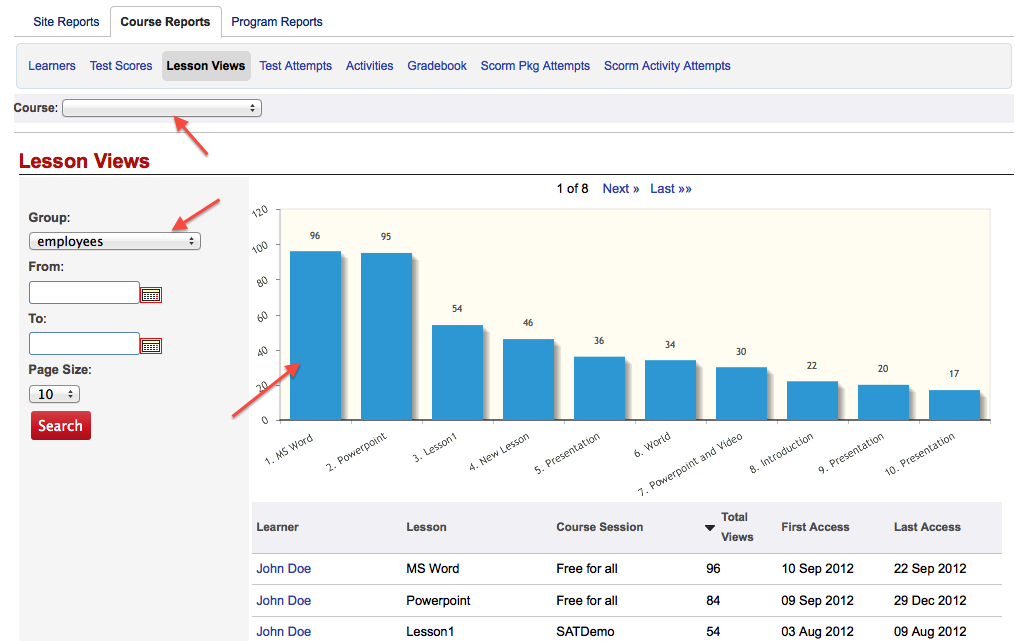
Lesson Views
This report shows the viewed lessons (sorted by number of times it was viewed) in a period, you can filter by group, course and course session. The table below chart shows users who viewed the lesson. Clicking on any bar in the chart shows a filtered list of users who actually viewed the lesson and how many times they viewed it (each page view is counted once)
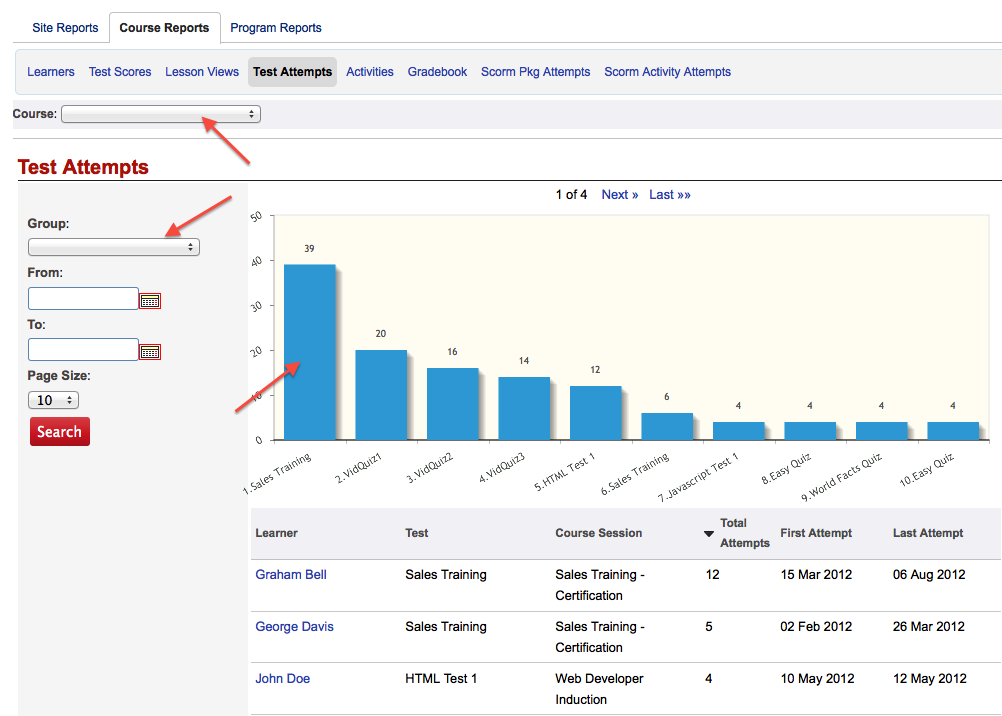
Test Attempts
This report shows the attempted tests (sorted by number of times it was attempted) in a period, you can filter by group, course and course session. The table below chart shows users who attempted the test. Clicking on any bar in the chart shows a filtered list of users who actually attempted the specific test and number of attempts
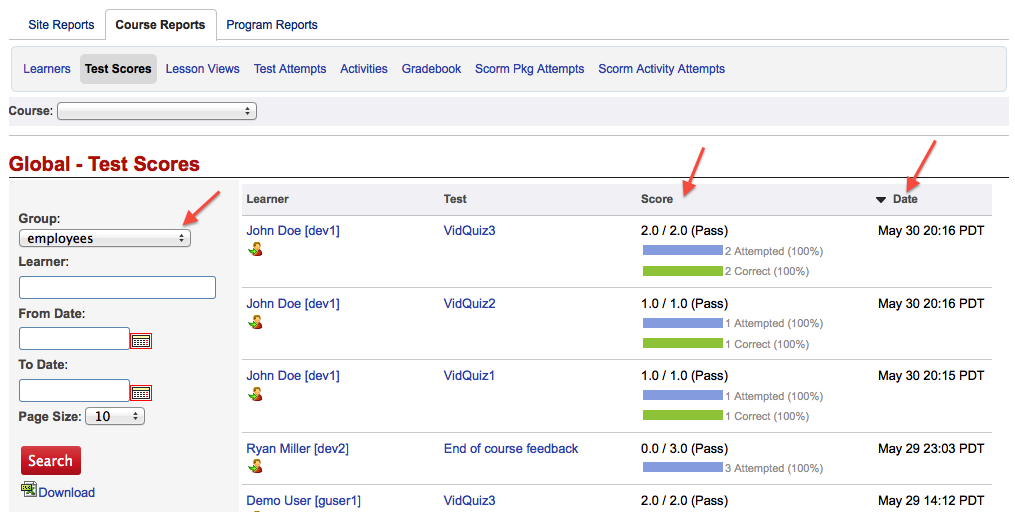
Test Scores
Additional filtering by group and sorting options are added in this report.